- NOTE
- We'll be going through this material today as a demo. You do not need to complete any assignments or exercises based on this project—it's presented solely to give you ideas about what kinds of analysis and visualizations you can do with this type of data, and to give you more examples of functioning code that you can crib from.

Building and visualizing datasets using data.seattle.gov and Google apps
In this project, we will explore a few ways to analyze and visualize data from data.seattle.gov. We will examine trends in the construction of houses, townhomes, and condos in Seattle over the last five years, in order to determine the true extent of the current "construction boom".
- We'll download data from two APIs (Socrata open data platform and Google Maps)
- We'll analyze trends over time in our dataset
- We'll look at building activity by neighborhood
- We'll visualize our data in graphs and heatmaps
Download and set up the Building Permit project
Click here to download the Building Permit project
- The ".zip" extension on the above file indicates that it is a compressed Zip archive. We need to "extract" its contents.
- Start up your terminal, navigate to the new directory you have unpacked called
bpdata.zip, and then set up the code by running:
download_building_permit_data.py
Now open up the CSV output file to verify that you got all the data you asked for.
You can view the full dataset we are pulling today's project data from at: https://data.seattle.gov/Permitting/Building-Permits-Current/mags-97de
- Challenge question
- how could we change our API query to download the applicant names for all COMMERCIAL building permits issued within the past year?
Aggregate new construction by neighborhood
- Question
- which Seattle neighborhoods have had the most multifamily residential construction (apartments and townhomes) since 2010?
Now we want to learn where all this new construction is happening. We'll do this by sending the address for each MULTIFAMILY permit to the Google Geolocation API, which will return the neighborhood where that address is located.
Run the script
multifamily_permits_by_neighborhood.py
Now open up the CSV output file and check your data. Does this look right to you?
- Challenge question
- In which Seattle neighborhood is the built value of new apartment construction projects highest, on average?
Map new home construction in Seattle
- Question
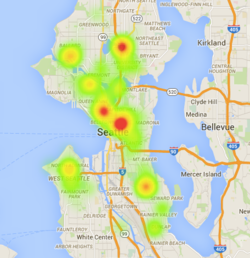
- what locations have experienced the highest density of new construction since 2010?
Now we will try to get an even more detailed picture of where this construction is occurring, using Google Fusion tables, a powerful visualization application that makes it easy to plot data on a map.
Go here and follow the steps to upload a CSV file that contains latitude and longitude.
- Create a point map and heatmap.
- Experiment with filtering and weighting the points on your map.
- Example map
- https://www.google.com/fusiontables/DataSource?docid=1wO2gon2Dxb4cVT0sUGHYanM7VGRwl-bZQLGLgqrf
Charting new construction by month
- Question
- Has the rate of residential construction increased since 2010?
Now we want to learn whether there is, in fact, a housing boom in Seattle. We'll do this by counting how many new permits are issued each month, and then plot these on a graph.
Run the script
residential_permits_by_month.py
Now open up the CSV output file and check your data. Does this look right to you?
- Challenge question
- how could we separate out single family homes from apartments, and count/plot them separately?
Going further
Try to answer these additional questions that draw on the data and methods we're learning today. How would you approach this analysis?
- Which developer has spent the most on new construction in Seattle since 2010?
- How many townhouses (as opposed to condos or freestanding homes) have been constructed in Seattle since 2010?
- Where in Seattle are the most commercial buildings being constructed in 2015?
- How does the rate of residential construction in Seattle from 2010-2015 compare to the previous 5 years?
Resources
Downloadable datasets
- Permits, last 5 years (today's dataset): https://data.seattle.gov/Permitting/Building-Permits-Current/mags-97de
- Permits older than 5 years: https://data.seattle.gov/Permitting/Building-Permits-Older-than-5-years/47eb-r92t
Sample visualizations
- Residential building permit Fusion Table: https://www.google.com/fusiontables/DataSource?docid=1wO2gon2Dxb4cVT0sUGHYanM7VGRwl-bZQLGLgqrf
Google Fusion tables
- Fusion tables overview: https://support.google.com/fusiontables/answer/2571232
- About Fusion table heatmaps: https://support.google.com/fusiontables/answer/1152262
- Other Fusion table tutorials: https://support.google.com/fusiontables/answer/184641
Google Maps API
- Intro to the Google maps geocoding API: https://developers.google.com/maps/documentation/geocoding/intro
- Sample API queries
- Google maps location (using street address): http://maps.googleapis.com/maps/api/geocode/json?address=5601+22ND+AVE+NW+Seattle+WA
- Google maps location (using lat/long): http://maps.googleapis.com/maps/api/geocode/json?latlng=47.66979666%2C-122.38570052
Other API resources
- Hurl.it API testing sandbox https://www.hurl.it
- Sample query for gathering building permit data from data.seattle.gov: https://data.seattle.gov/resource/mags-97de.json?$where=issue_date%20IS%20NOT%20NULL%20&action_type=NEW&category=MULTIFAMILY&$limit=100
Light reading
- Press about the construction boom
- http://www.theurbanist.org/2015/10/20/fact-check-no-explosion-in-demolitions/
- http://arcadenw.org/article/changing-seattle
- http://www.seattlemag.com/article/demolitions-seattle-no-neighborhood-unaffected
- http://www.seattletimes.com/pacific-nw-magazine/seattles-building-boom-is-good-news-for-a-new-generation-of-workers/
Socrata open data portal
- More about the Socrata open data portal and API: http://www.socrata.com/products/open-data-portal/
- Socrata API help resources: http://dev.socrata.com/consumers/getting-started.html
- filtering results: http://dev.socrata.com/docs/filtering.html
- dealing with timestamps: http://dev.socrata.com/docs/datatypes/timestamp.html
- writing API queries: http://dev.socrata.com/docs/queries.html
- Data portal-powered apps
- Socrata API instructional videos
- https://data.seattle.gov/videos
- https://www.youtube.com/watch?v=YlKzXTrTLOQ
- https://www.youtube.com/watch?v=Whfp8ojMf0U
- https://www.youtube.com/watch?v=Vd6bwz3ivVA
- Some other government website that use the Socrata API
